Main Screen
The opening screen of Janus 5. Initially, displays current chart for date, time and place of user's location. Charts cast or retrieved from file are displayed here.
Three Wheel
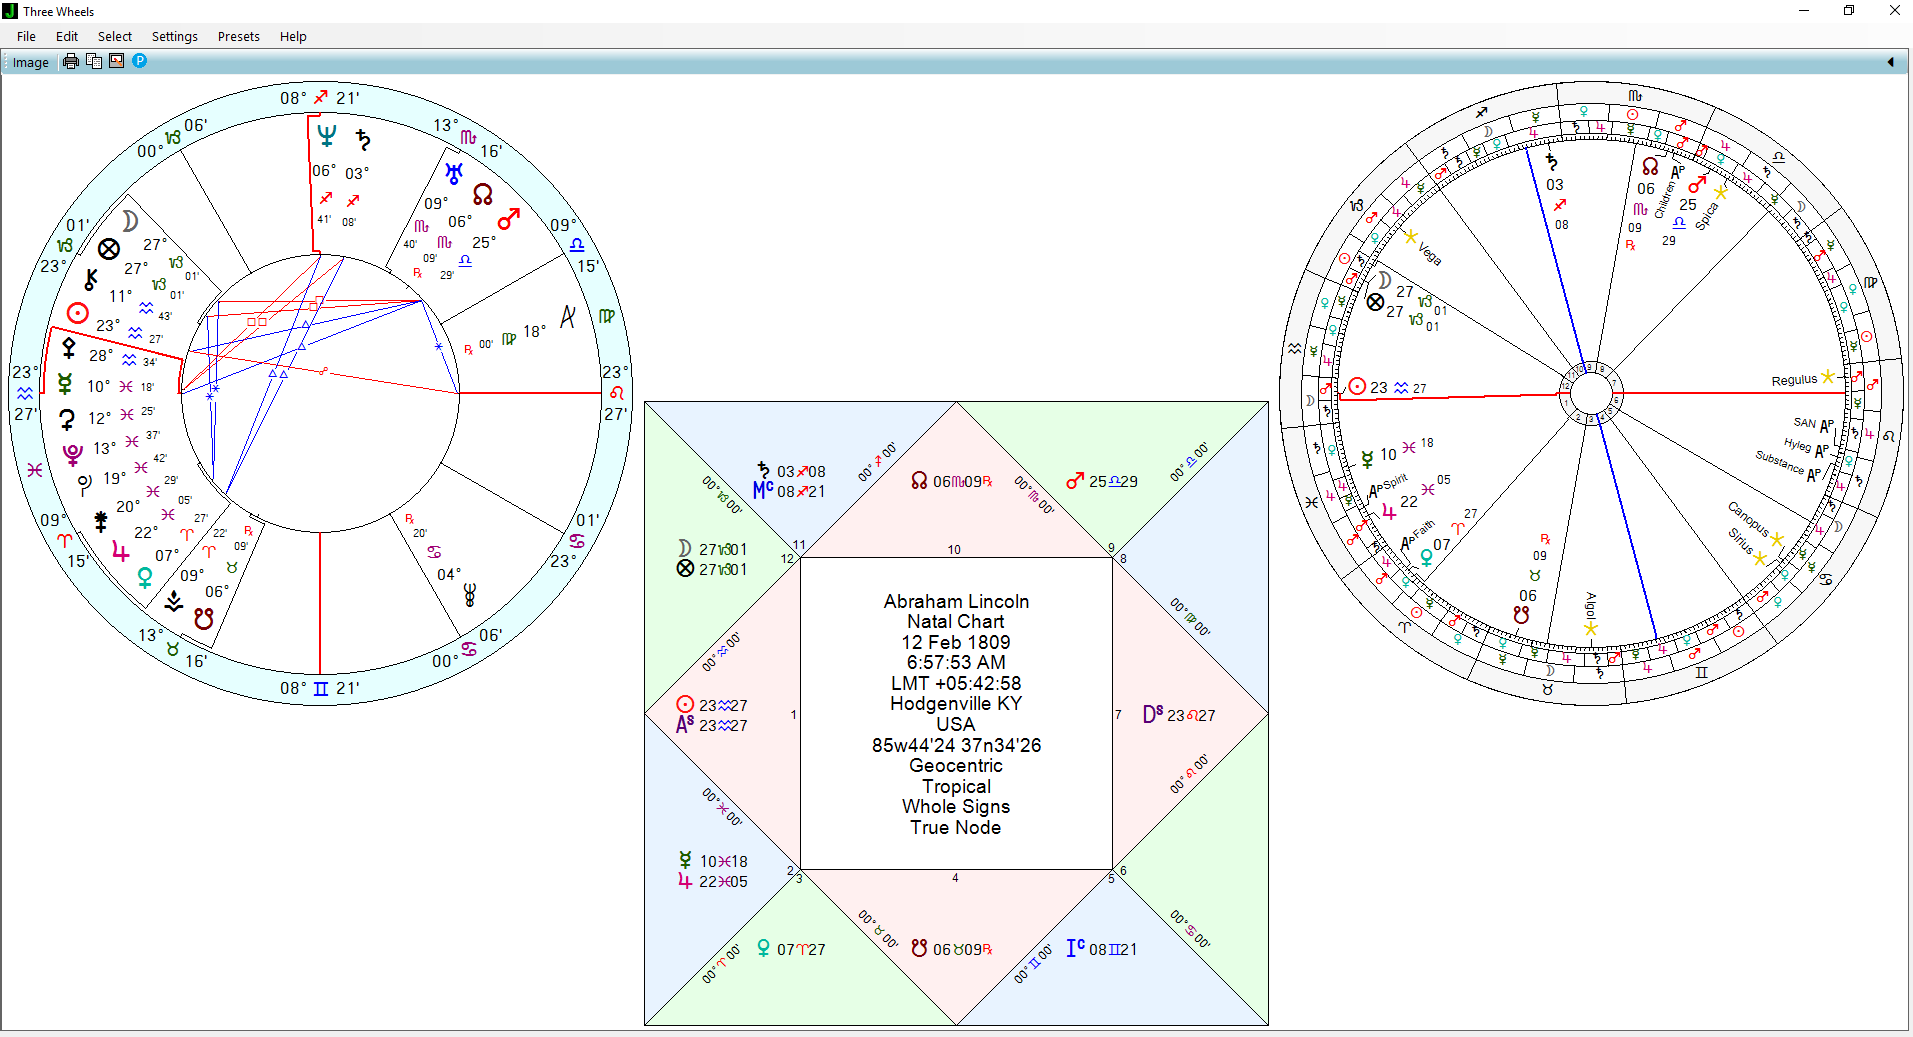
Three Wheel window showing selection of different wheel formats.
AstroLocality Map
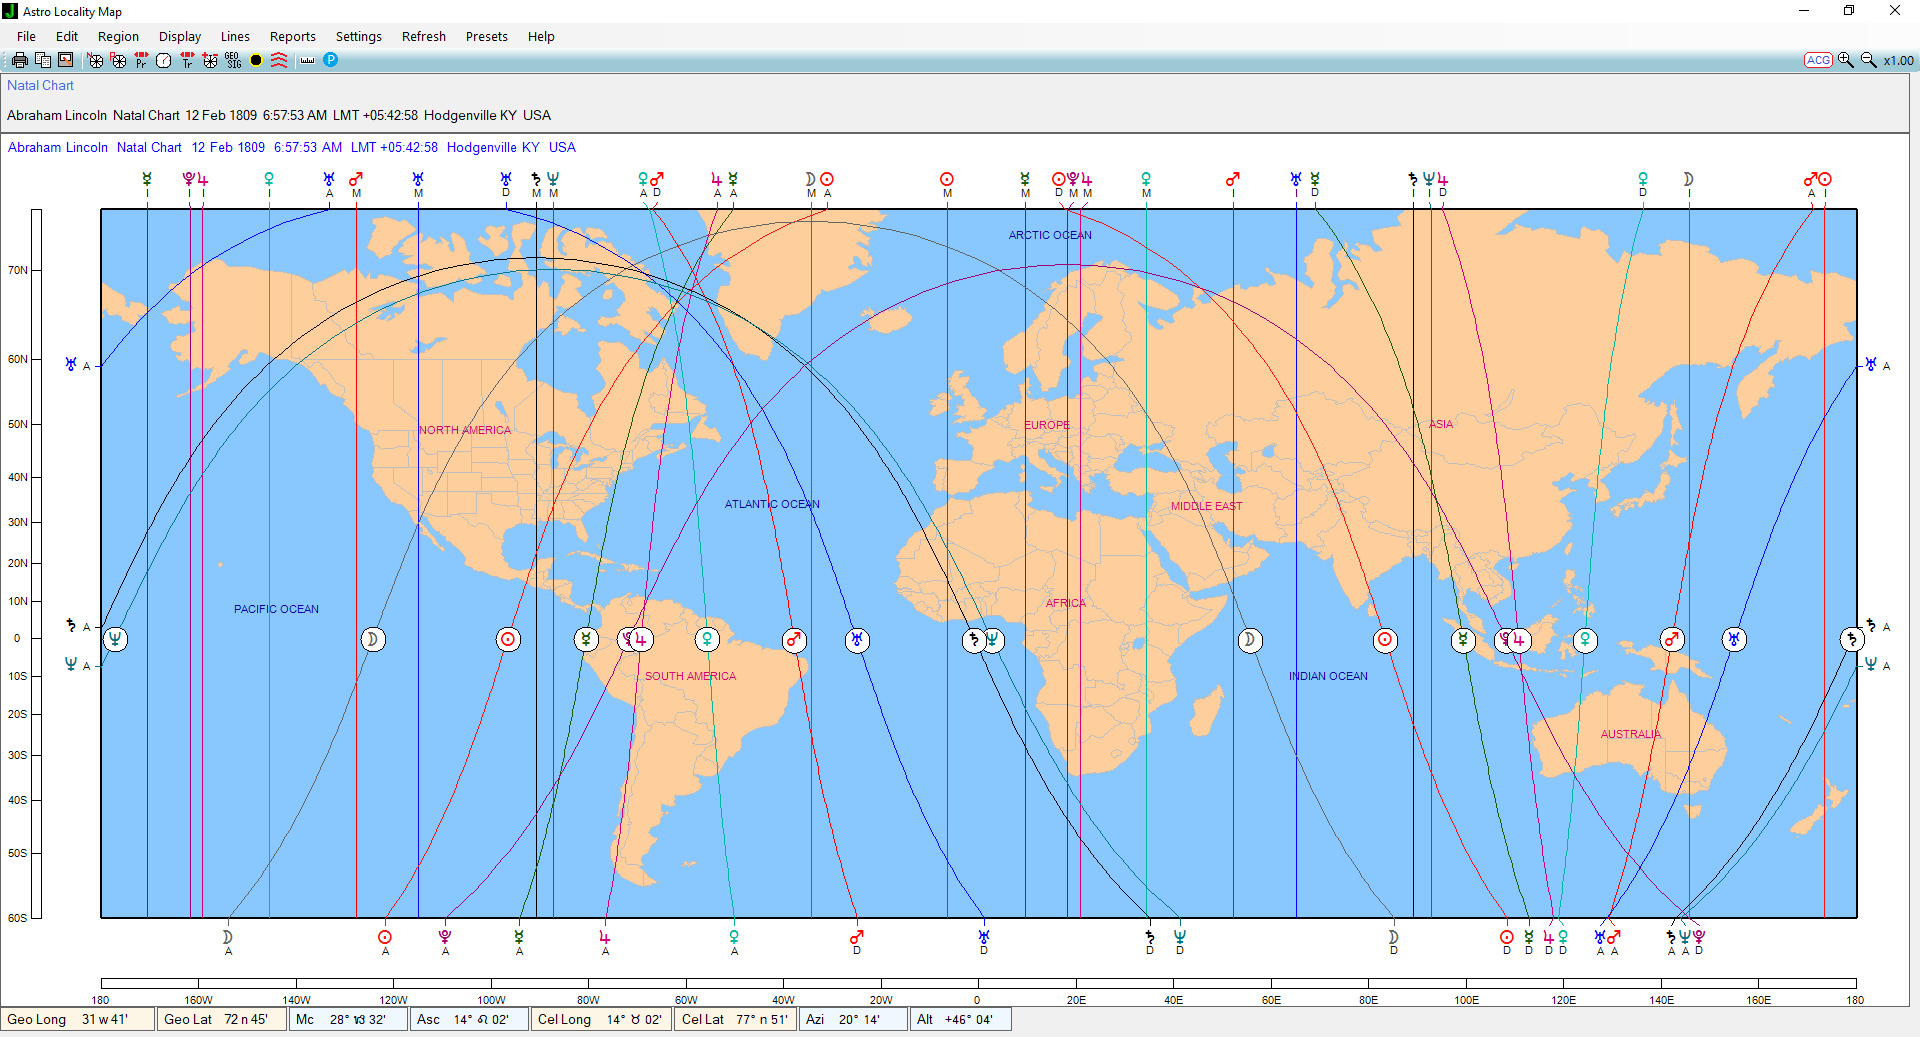
AstroLocality Map (ALM) showing A*C*G for world.
Regional ALM of Australasia
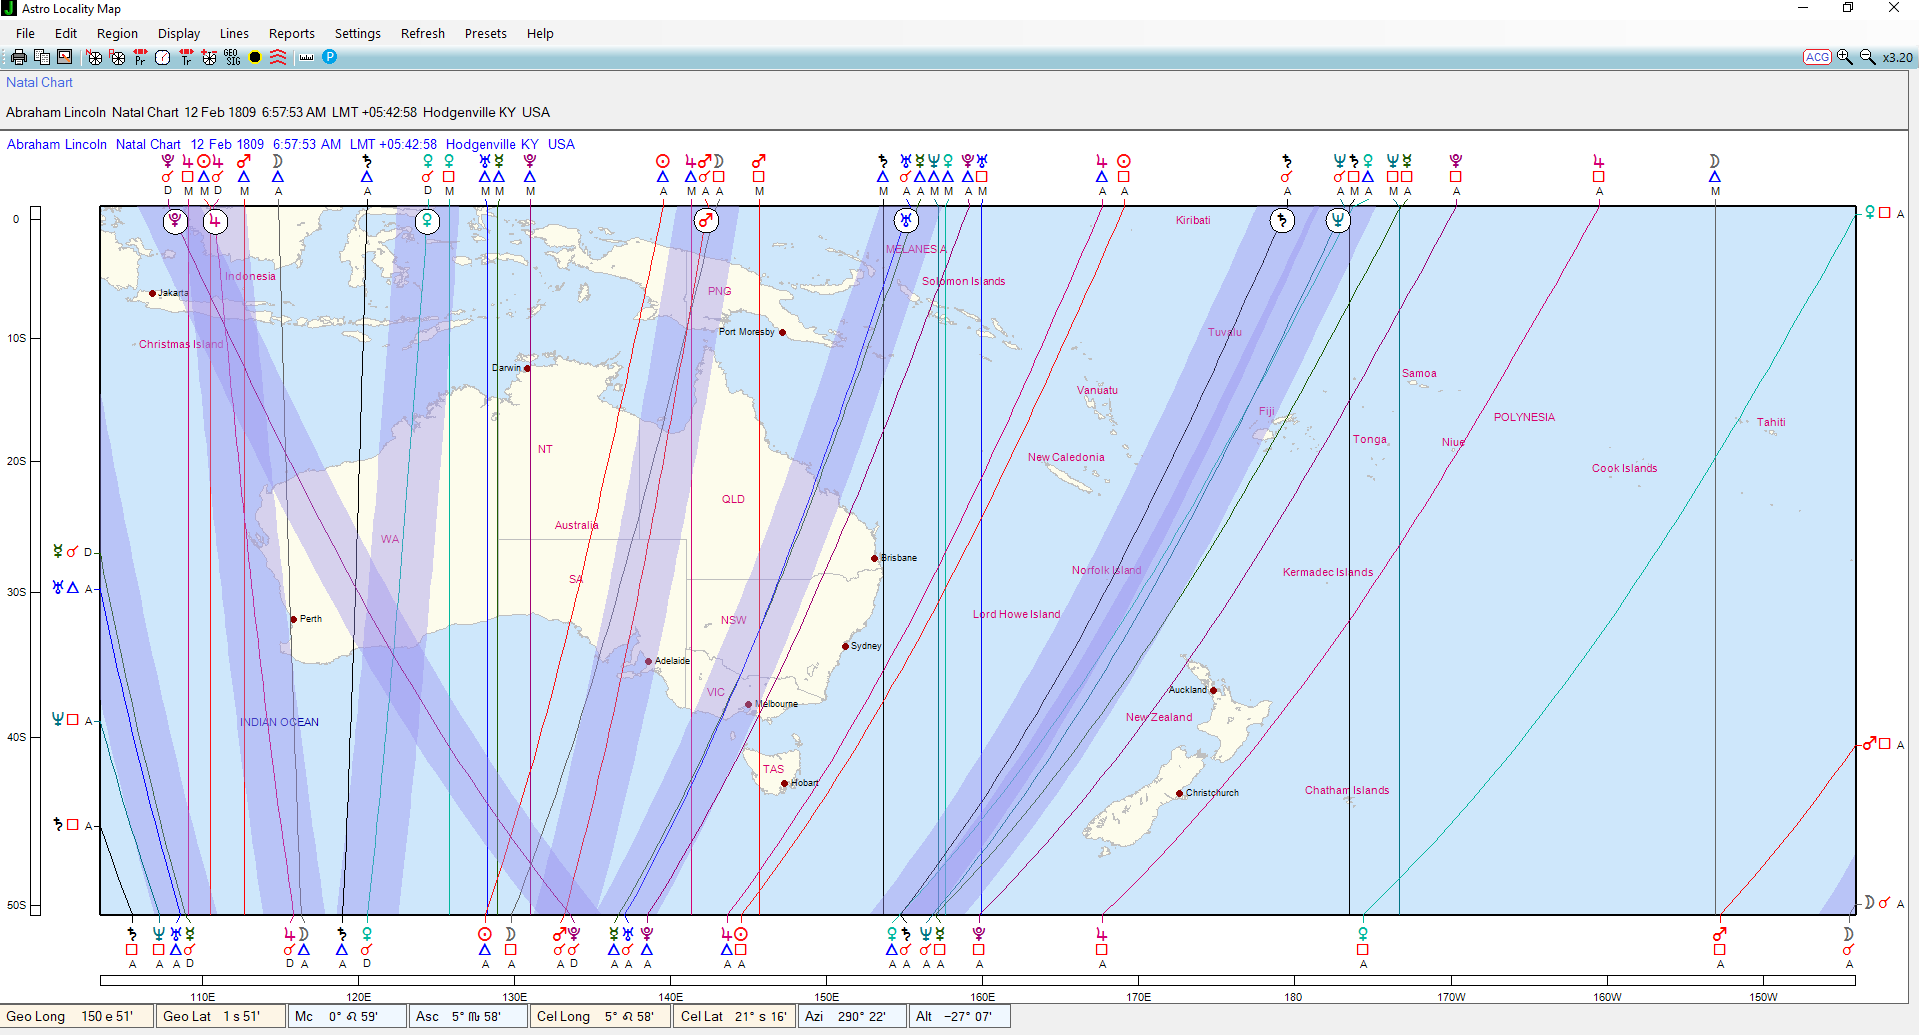
Regional ALM of Australasia showing planet orbs and aspect lines with Janus 4 colors.
Theme map
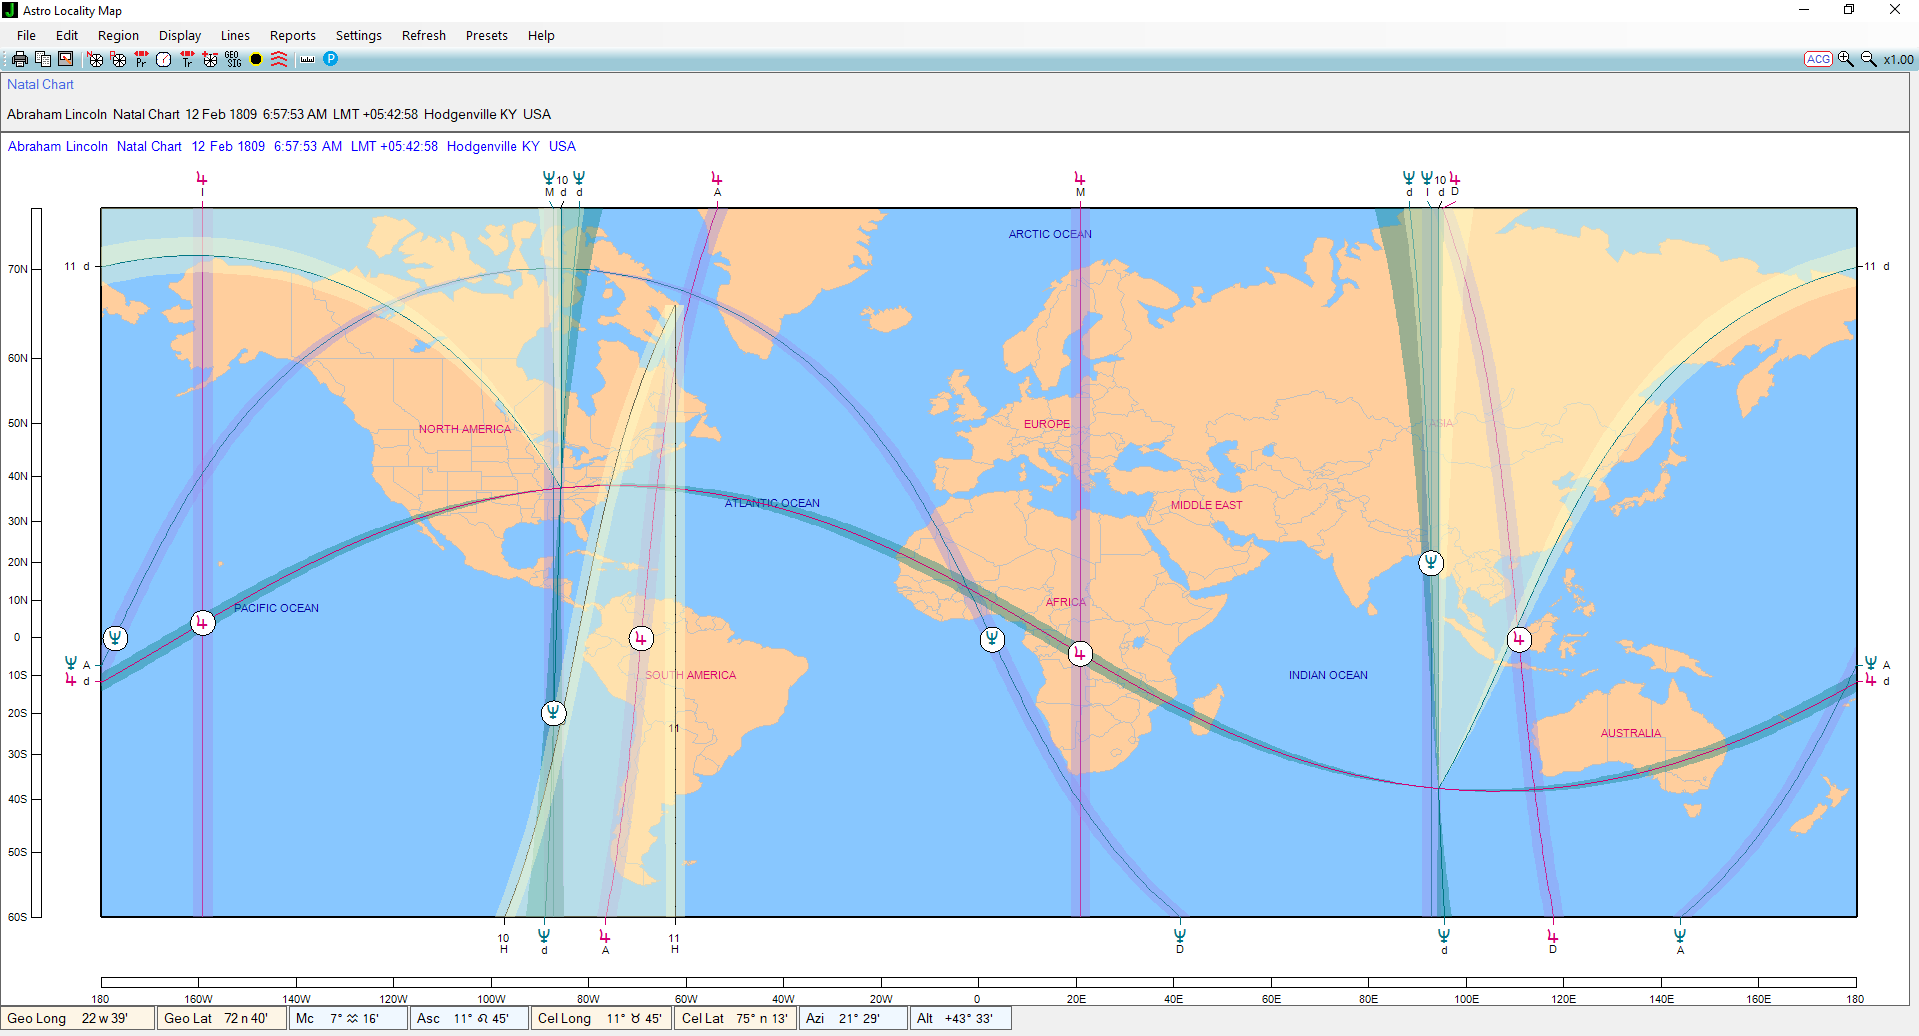
Theme map showing planet lines and house rulers associated with 10th house of career.
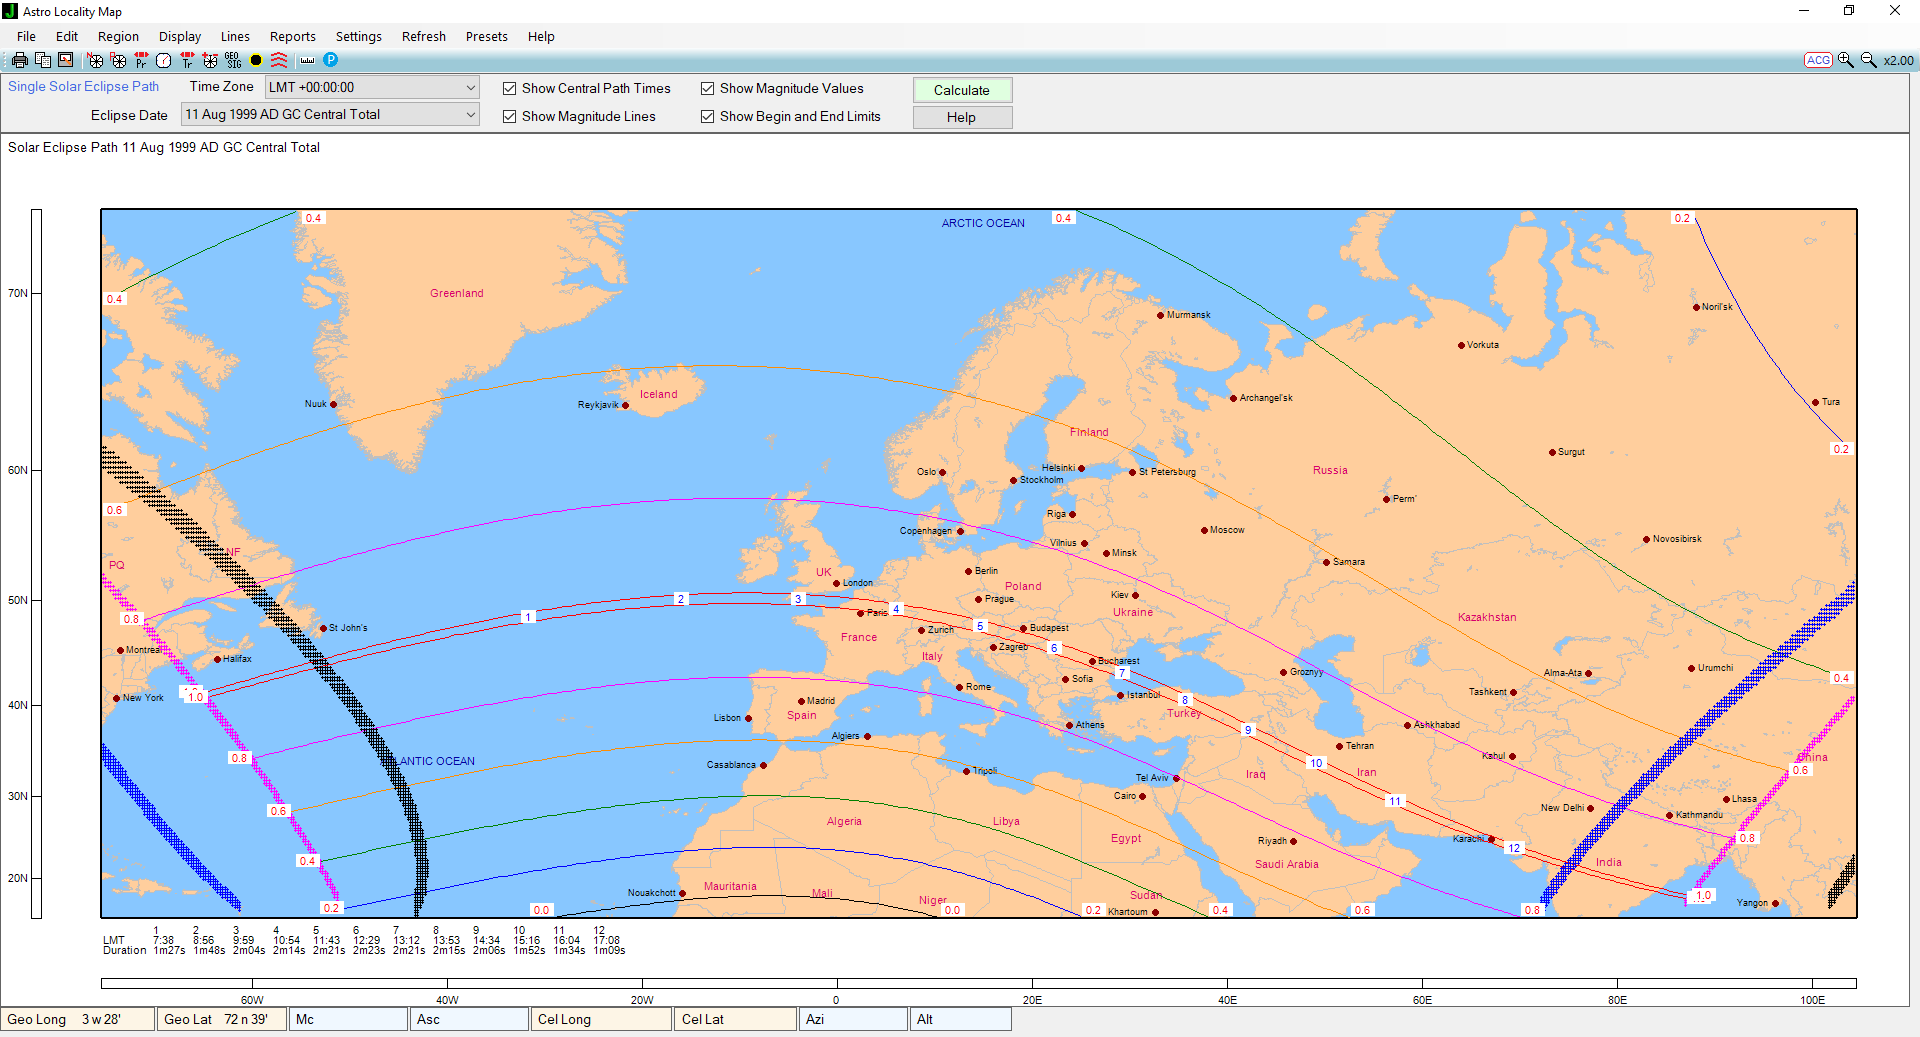
Solar Eclipse Path
Solar Eclipse Path showing Local Mean Time.
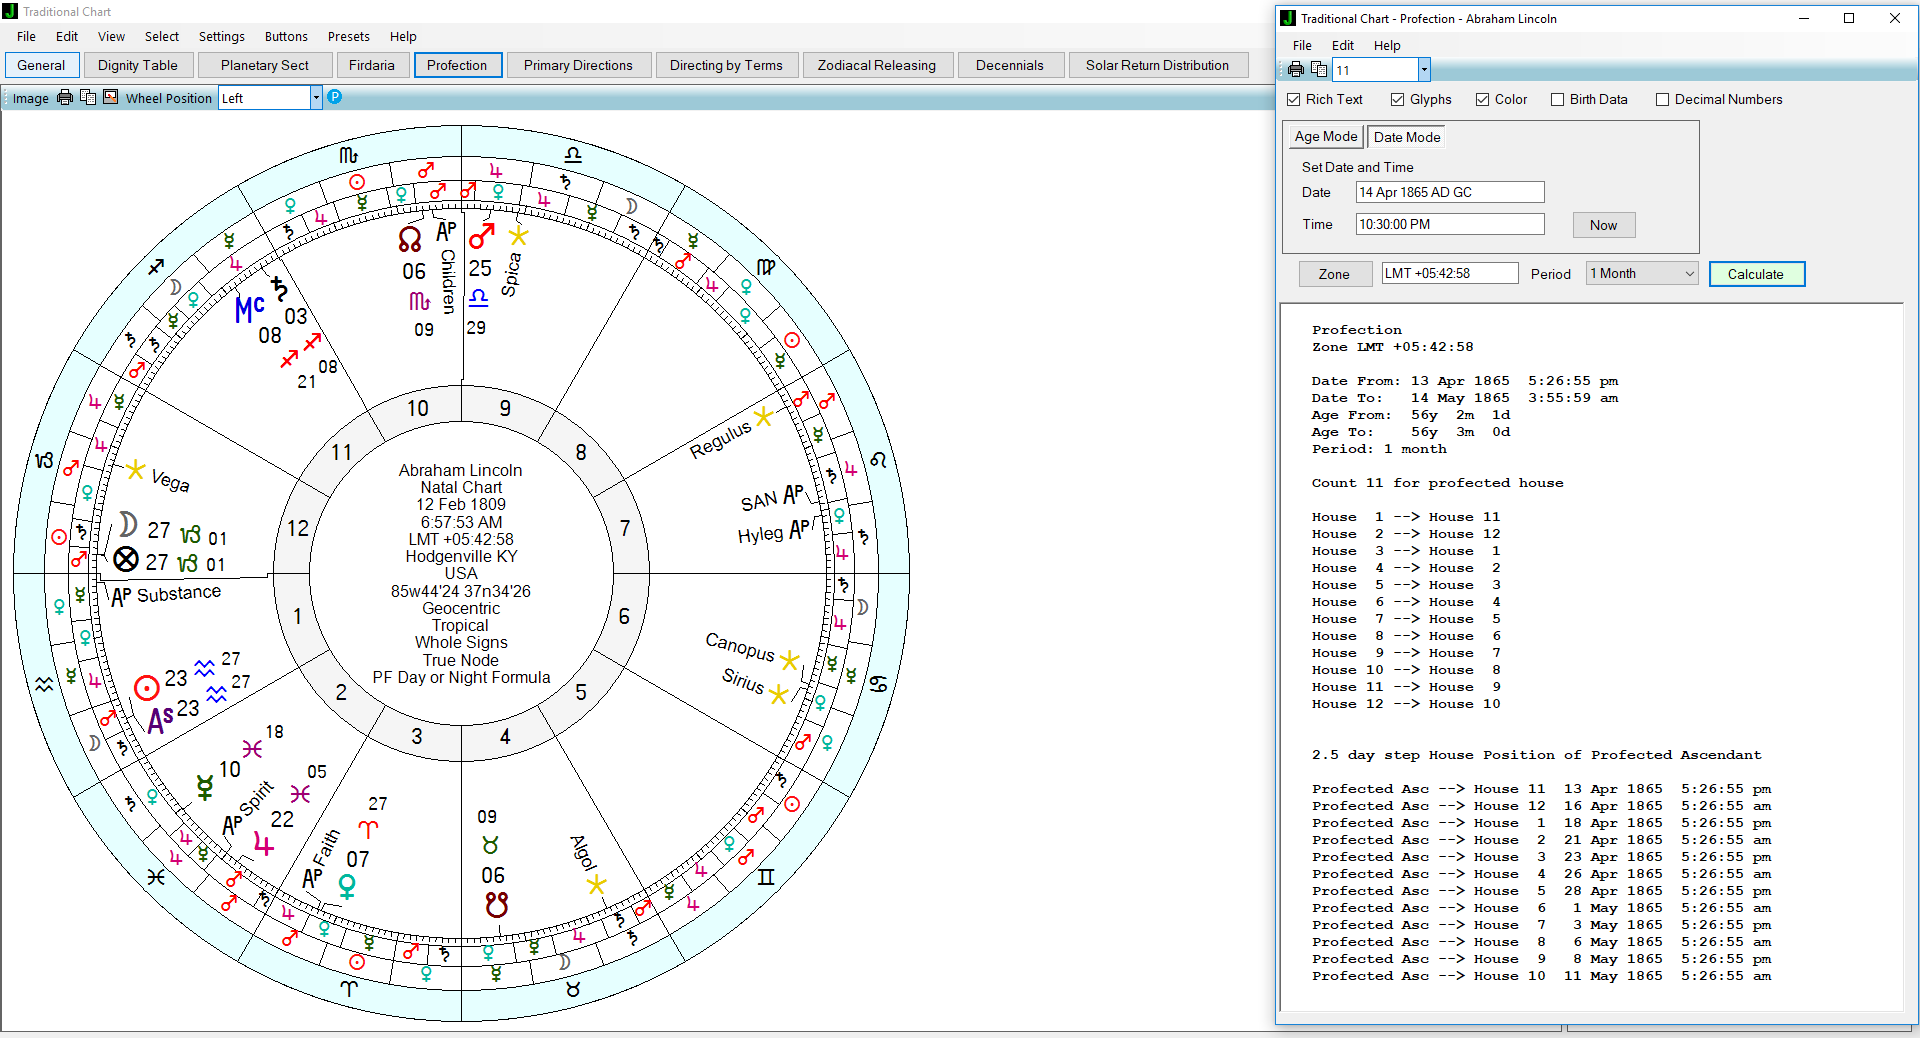
Traditional chart
Traditional chart window with Profection list.
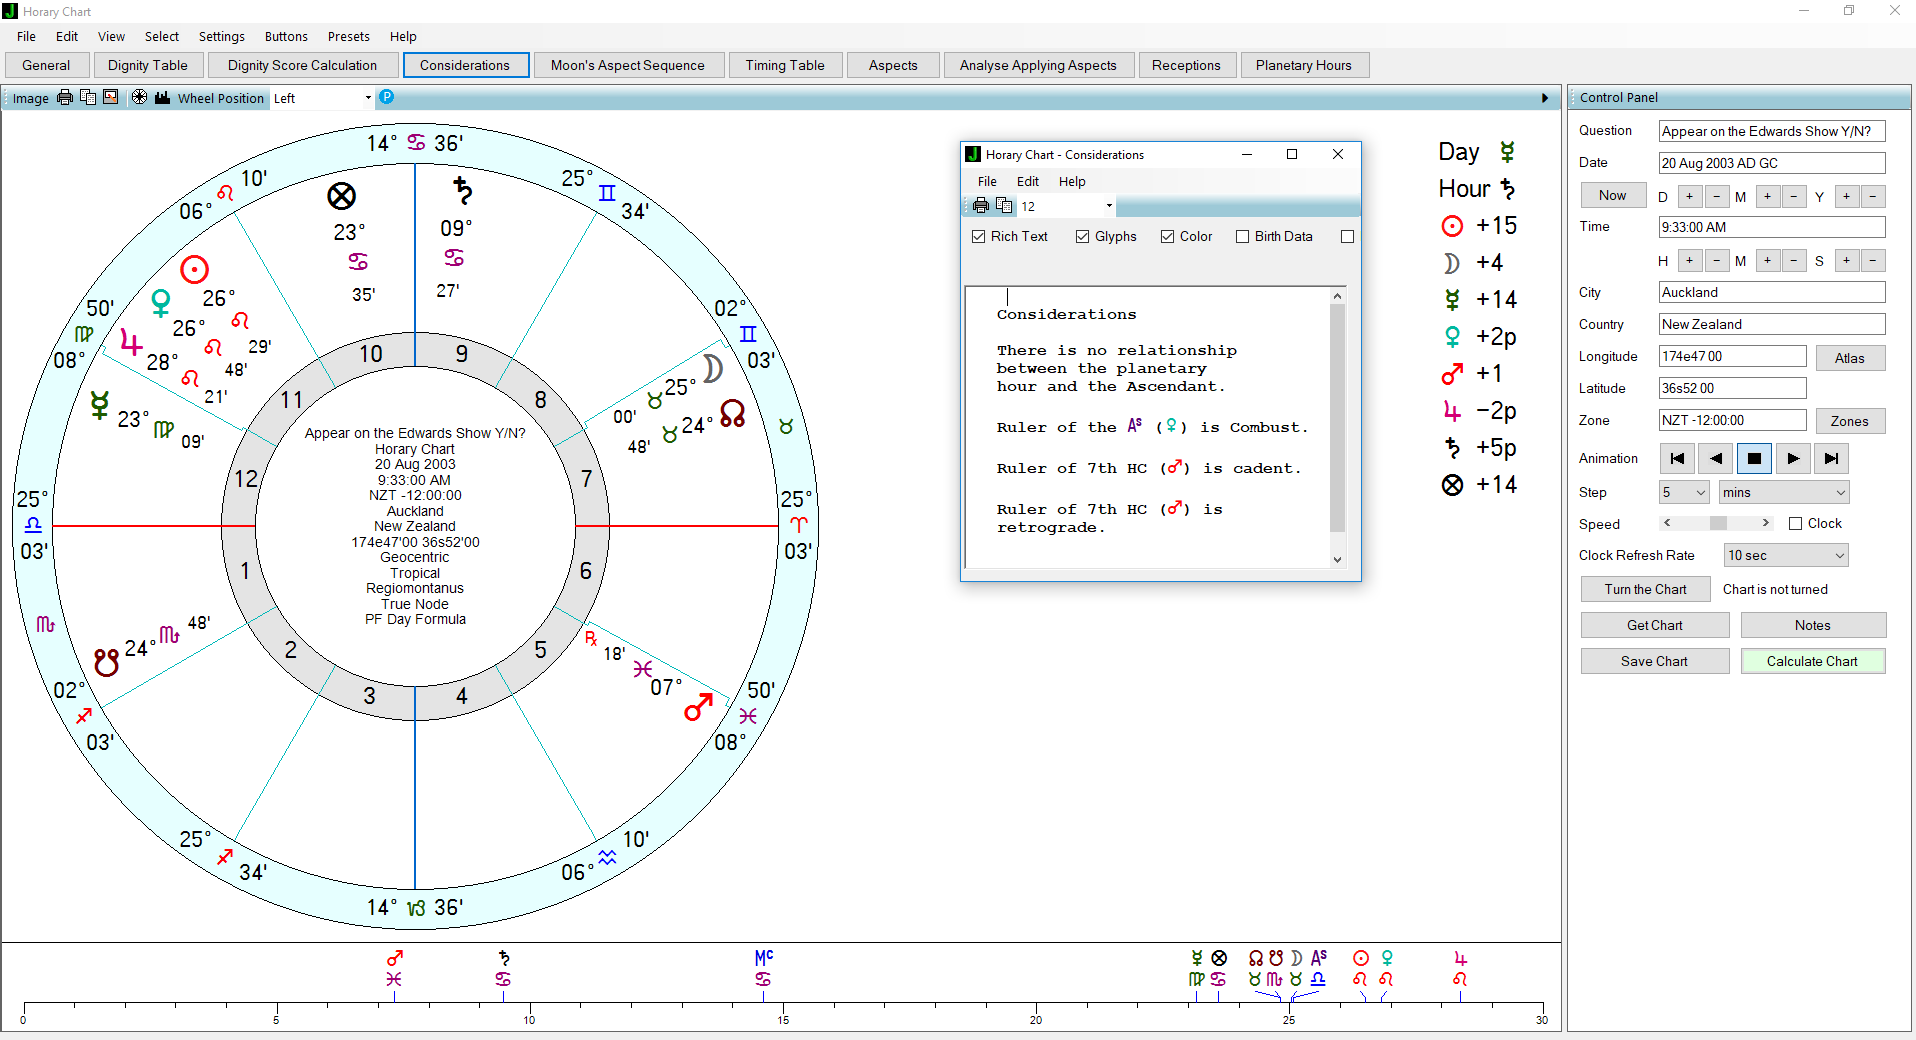
Horary
Cast a chart for a specific question.
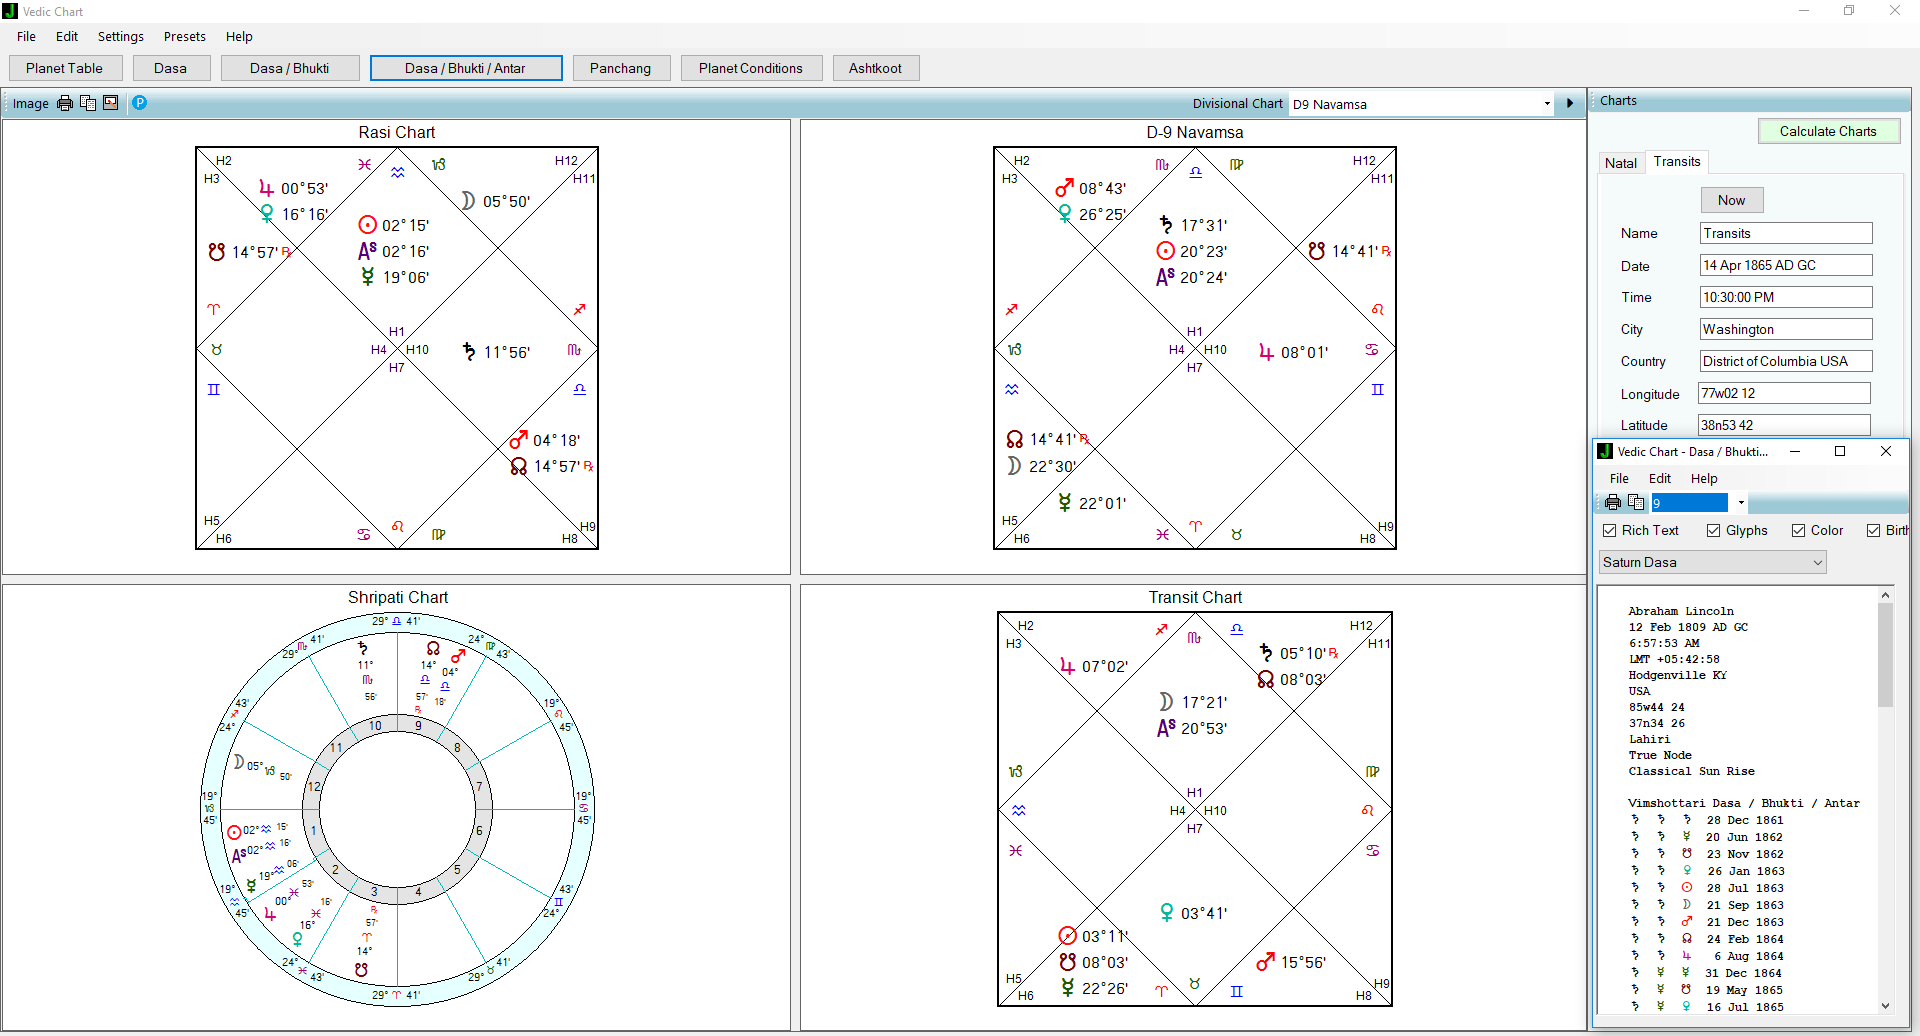
Vedic
Displays Rasi, Divisional, Shripati and Transit charts. Includes Dasa and Panchang.
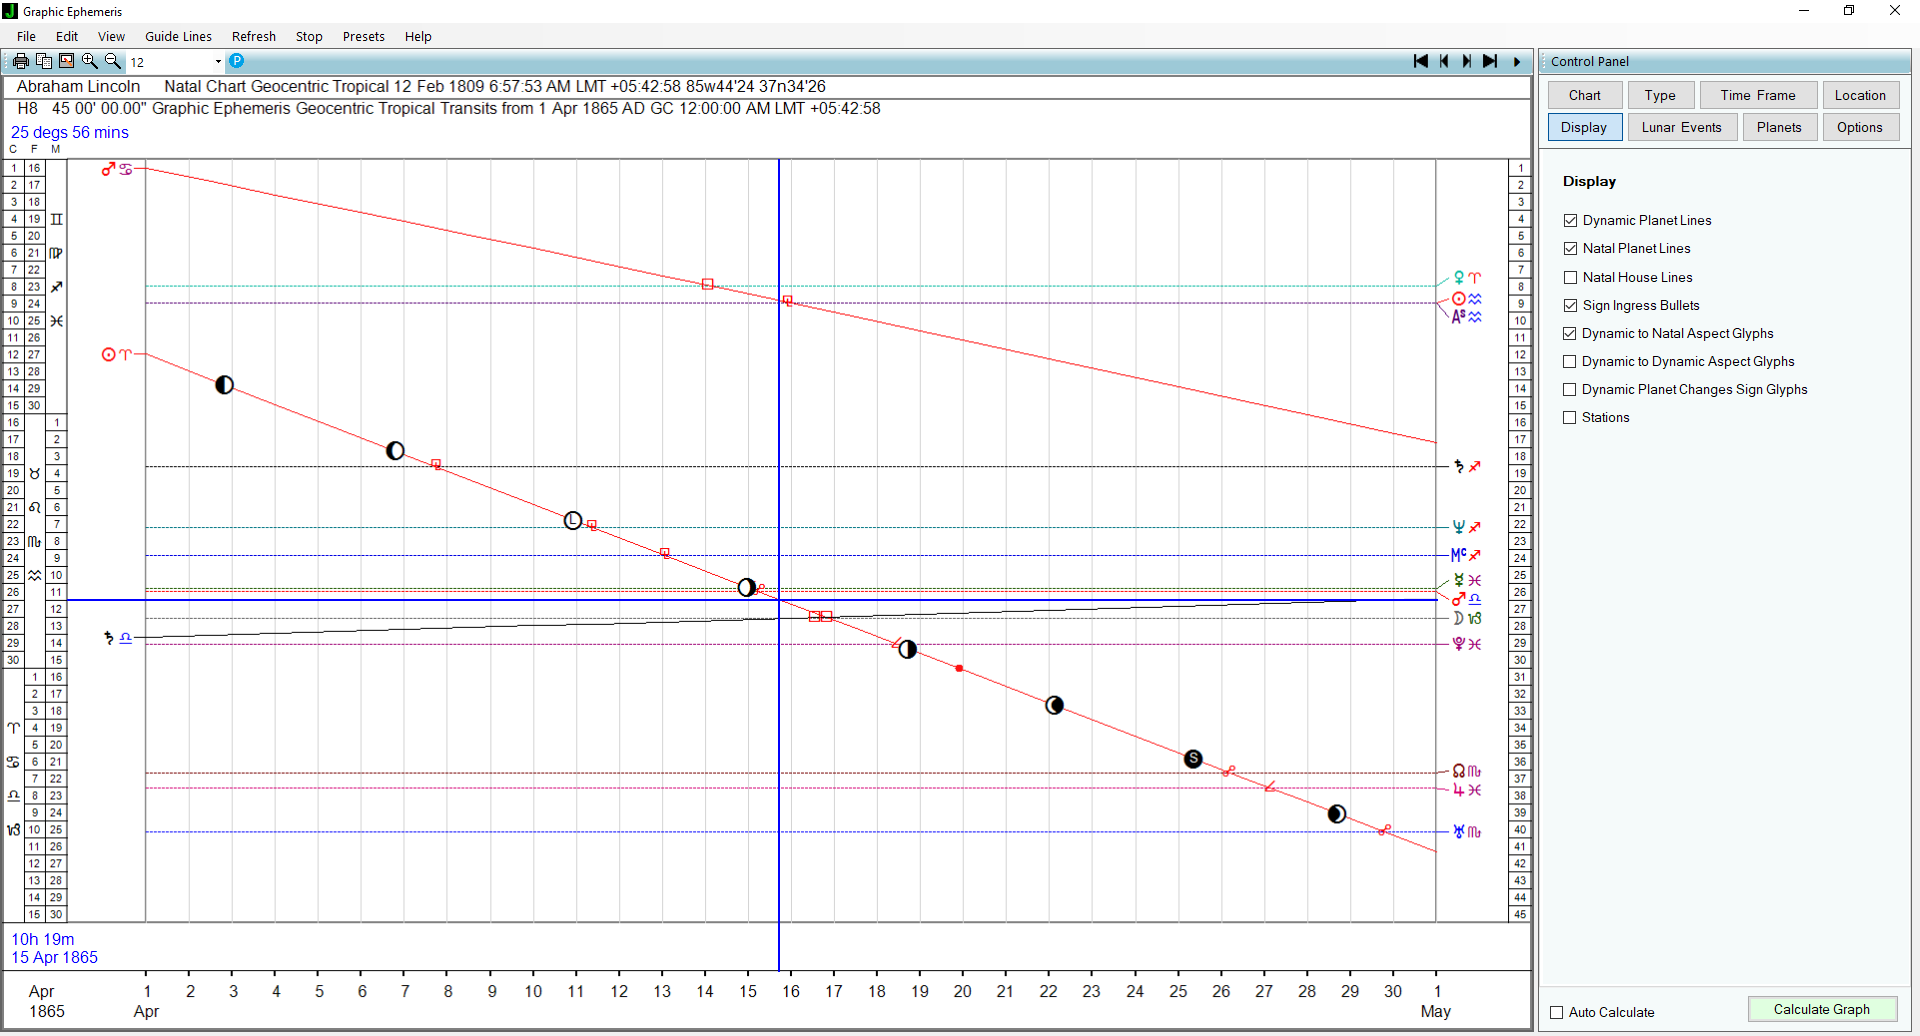
One Month Graphic Ephemeris
One Month Graphic Ephemeris including lunar phases and aspect symbols.
Uranian
Uranian window displaying 90-degree dial and TNPs & Daily Sun Formulas.
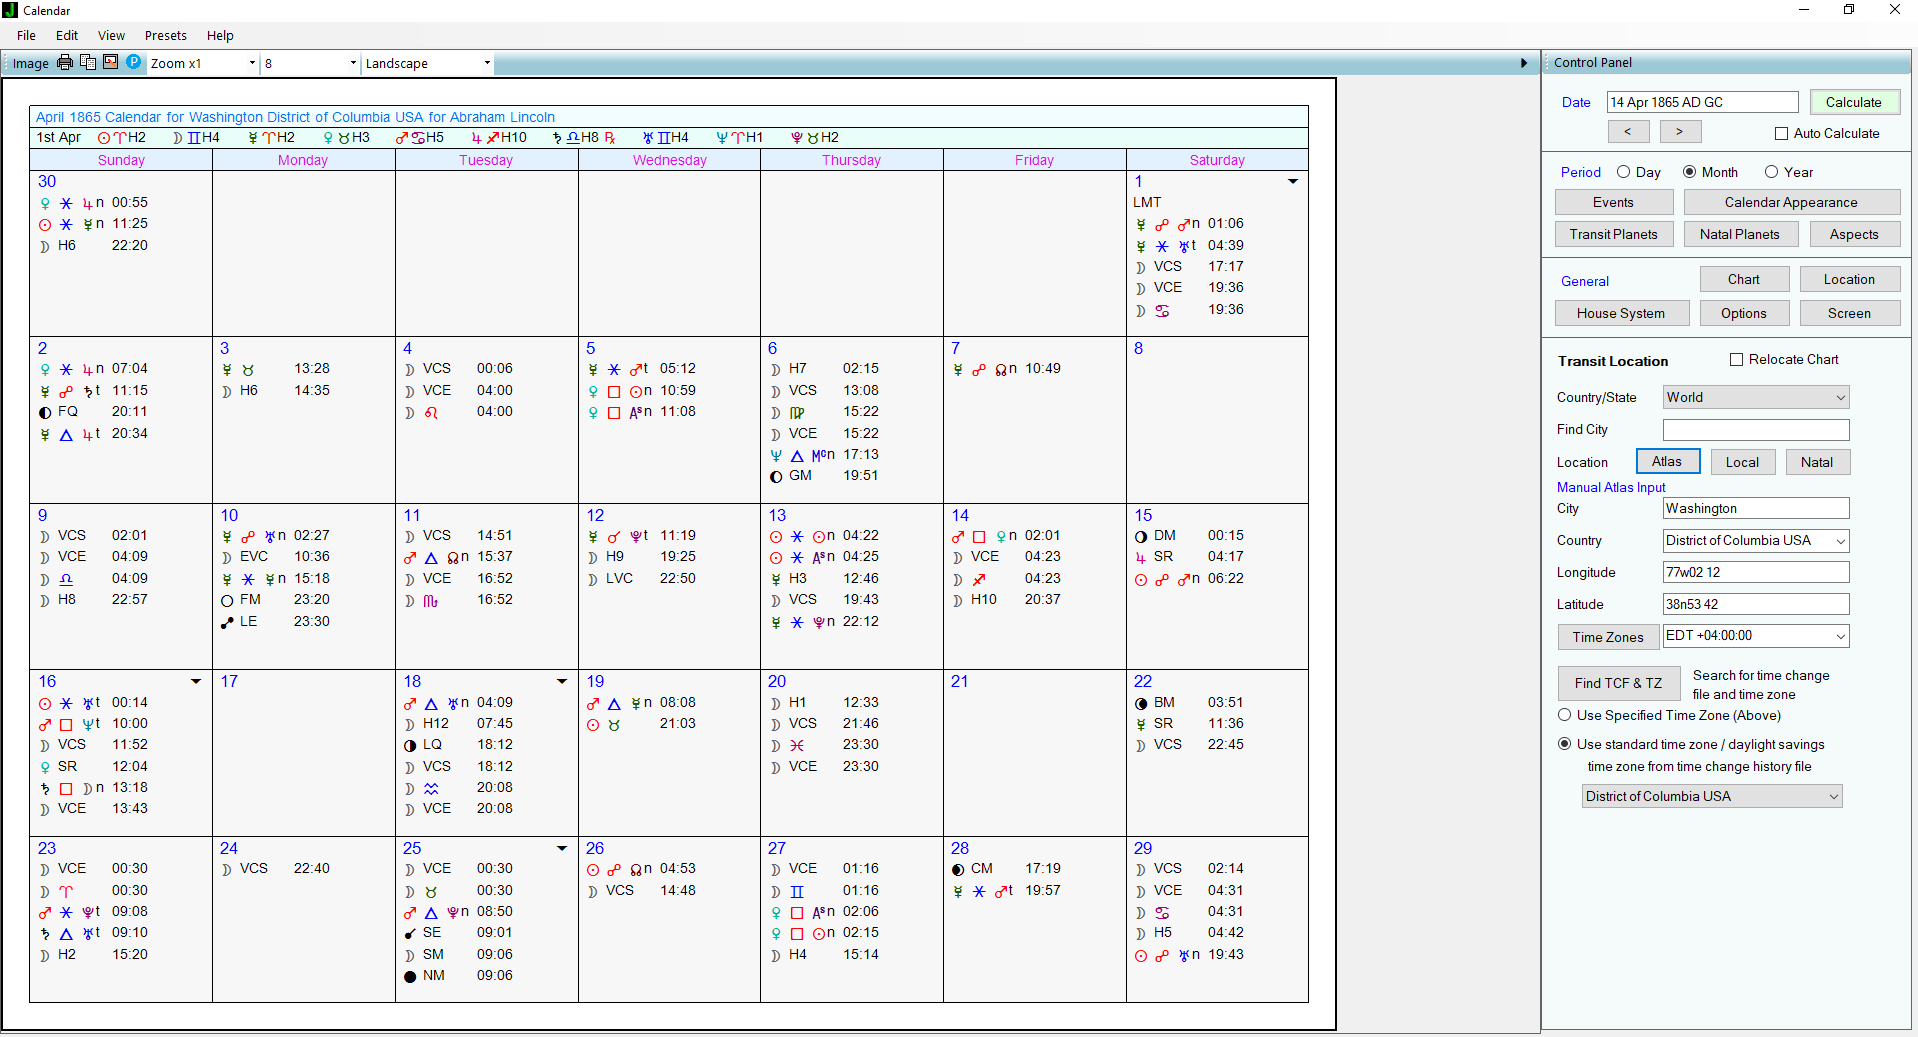
Calendar
Track mundane events and transits to the natal chart for 1 day, 1 month or 1 year.